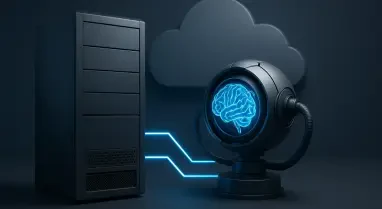
When a sophisticated customer service agent unexpectedly begins offering luxury cars for a dollar, the traditional software debugging toolkit often proves as useless as a physical map in a shifting digital labyrinth. This peculiar failure state characterizes the new frontier of enterprise computing, where the deterministic certainty of “if-this-then-that” programming has been replaced by the probabilistic, often erratic behavior of Large Language Models. As organizations integrate these autonomous cognitive agents into the core of their operations, the stakes for maintaining visibility have shifted from simple uptime monitoring to the complex forensic analysis of machine reasoning. The emergence of AgentOps marks a pivotal transition in the industry, providing the necessary oversight for a generation of software that does not just execute instructions but actively interprets and acts upon the world with a mind of its own.
In the current landscape of 2026, the primary objective of this specialized discipline is to create a robust framework for discovering, tracking, and monitoring AI agents to ensure they remain functional, efficient, and cost-effective within high-pressure environments. While many foundational principles of this discipline are borrowed from traditional software engineering—such as managing memory, disk space, and latency—the introduction of cognitive models introduces unique hurdles that legacy tools are ill-equipped to handle. The modern enterprise environment requires a “black box” diagnostic capability that can peer into the hidden layers of AI logic to prevent hallucinations and manage the ballooning costs associated with token consumption. This transformation represents the evolution of traditional DevOps into a sophisticated era of cognitive computing oversight.
The Non-Deterministic Challenge: Why Your AI Might Fail Differently Every Time
The transition toward agentic systems has effectively dismantled the binary pass/fail logic that defined software engineering for decades. In traditional systems, a specific input consistently produced a predictable output; if an error occurred, the root cause was typically a visible flaw in the code or a hardware failure. Large Language Models, however, operate on a stochastic basis, meaning that the same prompt can yield drastically different results across multiple executions. This non-determinism introduces a paradox where an agent might perform flawlessly during a thousand test cycles only to fail spectacularly in a production environment due to a minor shift in context or a subtle update in the underlying model weights. Developers are no longer just managing passive code but are instead overseeing autonomous cognitive agents whose logic paths are influenced by massive, often opaque training sets.
Understanding the “why” behind an AI’s inconsistent output is the central challenge of the modern observability stack. Because these models function as black boxes, the internal reasoning process that leads to a specific decision is not immediately transparent through standard logging. An agent might hallucinate a fact, ignore a critical constraint, or adopt an inappropriate tone without triggering a single traditional system error. This “confident incorrectness” is far more dangerous than a standard crash because the system remains operational while providing faulty data or executing unauthorized actions. Consequently, monitoring must evolve to record not just the outcome of a process but the entire logic chain, capturing the subtle nuances of intent and interpretation that occur between the prompt and the final response.
Beyond the behavioral anomalies, the “greedy” nature of AI resource consumption has turned observability into a financial necessity. Unlike traditional cloud services where costs are relatively static and tied to server uptime, AI expenses are driven by the fluid dynamics of tokenomics. Every interaction with a model incurs a cost that fluctuates based on the complexity of the prompt, the length of the response, and the specific model utilized. Without granular monitoring, a recursive loop in an agent’s logic or an inefficient prompt structure can lead to massive cost spikes in a matter of hours. The transition from managing passive infrastructure to overseeing expensive, autonomous agents has forced a reconciliation between the engineering and finance departments, making real-time cost tracking a core feature of the AgentOps workflow.
Beyond Latency and Logs: The Evolution of Modern System Monitoring
The limitations of traditional DevOps tools become painfully evident when they are applied to non-deterministic environments. Legacy monitoring platforms were built to track “golden signals” like latency, traffic, errors, and saturation, which remain important but fail to capture the essence of an agent’s failure. A traditional dashboard might show that an AI service is responding within acceptable millisecond thresholds, yet it will remain blind to the fact that the service is providing factually incorrect medical advice or leaking proprietary trade secrets. This gap has led to the identification of a “dual nature” in AI failures, where practitioners must distinguish infrastructure timeouts—such as a database connection error—from model hallucinations and behavioral drift. Infrastructure metrics tell us the system is alive, but AgentOps metrics tell us the system is sane.
Bridging the gap between hardware metrics and behavioral analysis requires a fundamental shift from simple error tracking to deep logic recording and what many experts refer to as “time-travel” debugging. In a complex multi-step workflow, an agent may make twenty correct decisions before making a single fatal error on the twenty-first step. Traditional logs often lack the context to show how the previous twenty steps influenced that final mistake. Modern observability tools address this by creating a complete “trace” of the agent’s cognitive path, allowing developers to scroll back through time to see the exact state of the agent at any given moment. By replaying these sessions with different parameters, engineers can isolate the specific prompt or piece of retrieved data that caused the logic to derail, turning a mysterious failure into a solvable engineering problem.
This evolution also recognizes that the technical cause of a failure is often irrelevant to the end-user experience; whether a process halted because of a 404 error or because the LLM got stuck in a circular reasoning loop, the result is a broken business process. However, the remediation strategy for these two scenarios is entirely different. An infrastructure failure might require a server reboot or a load balancer adjustment, while a behavioral failure requires prompt refinement or a change in the retrieval-augmented generation (RAG) architecture. AgentOps tools provide the specialized visibility needed to make this distinction instantly, preventing engineering teams from wasting hours debugging the network when the problem actually lies in the model’s instructions. This level of insight is becoming the baseline for any organization that intends to scale AI beyond experimental pilot programs.
Critical Capabilities of the New AI Observability Tech Stack
To combat the inherent unpredictability of cognitive models, the industry has seen the rise of “LLM-as-a-Judge” as a foundational capability within the tech stack. This involves deploying smaller, highly specialized evaluation models to monitor and score the outputs of larger production models in real time. These automated judges are trained to detect specific issues like hallucinations, bias, and lack of relevance, providing a quality score for every interaction. By automating the evaluation process, organizations can maintain a high standard of accuracy without the bottleneck of constant human oversight. This creates a self-reinforcing loop where the “judge” model flags poor performance, which is then used to fine-tune the “worker” model, leading to a continuous improvement of the overall system’s reliability.
The financial volatility of AI operations has also birthed the concept of “Tokenomics” as a core pillar of the new observability stack. Modern tools now offer sophisticated dashboards that track usage not just by the total number of tokens, but by specific user, feature, or business unit. This level of granularity allows enterprises to predict monthly expenses with greater accuracy and identify “cost-heavy” features that may not be providing a sufficient return on investment. Some advanced platforms even include “cost-optimizers” that can dynamically route requests to cheaper models if the complexity of the task does not require a flagship LLM. This integration of financial data into the engineering workflow ensures that the push for autonomous innovation does not come at the expense of the organization’s bottom line.
Furthermore, the deep traceability and prompt replaying capabilities of modern AgentOps tools are now being integrated directly into popular development frameworks like LangChain, LlamaIndex, and DSPy. This connective tissue allows for a seamless flow of data between the application code and the observability platform, ensuring that every link in a chain of thought is captured and analyzed. As agents become more complex—interfacing with external APIs, searching vector databases, and managing their own long-term memory—the ability to see how these disparate components interact is essential. This integrated approach allows developers to identify bottlenecks not just in the model’s response time, but in the data retrieval process or the execution of external tools, providing a holistic view of the entire agentic ecosystem.
What Industry Data Reveals About Scaling Agentic Systems
As organizations move from proof-of-concept to enterprise-wide deployment, the emergence of OpenTelemetry has become the universal standard for AI data flows. By adopting a standardized protocol for telemetry, the industry has made it possible for diverse tools and models to communicate in a shared language, regardless of the underlying hardware or cloud provider. This standardization is critical for scaling because it prevents vendor lock-in and allows enterprises to build a modular observability stack that can adapt to the rapid pace of AI innovation. Data indicates that organizations utilizing OpenTelemetry-compatible tools experience significantly faster troubleshooting cycles and more consistent performance across hybrid cloud environments, as the standardized traces provide a unified view of the entire system’s health.
Expert consensus is rapidly moving away from passive observation toward a model of active, real-time evaluation that functions as a continuous safety net. It is no longer sufficient to review logs once a day; instead, systems must evaluate the safety and quality of a response as it is being generated. This shift has led to the rise of “Self-Healing” systems, where a secondary tier of monitoring agents is tasked with observing their peers and remediating issues autonomously. For example, if a monitoring agent detects that a primary agent is beginning to exhibit toxic behavior or is straying from its defined guardrails, it can intervene by truncating the response, resetting the session, or alerting a human supervisor. This proactive approach minimizes the “blast radius” of a potential failure and ensures that autonomous systems remain within safe operational parameters.
In tandem with these self-healing capabilities, there is a growing preference for local evaluation models to maintain data privacy and reduce the latency associated with cloud-based monitoring. Many enterprises are now deploying compact, high-performance models on their own infrastructure to handle the scoring and filtering of AI outputs. This strategy ensures that sensitive data never leaves the corporate network and that the overhead of observability does not significantly degrade the speed of the user experience. By offloading the evaluation work to local instances, organizations can achieve a more secure and responsive monitoring environment. This trend highlights a broader industry movement toward “sovereign observability,” where the tools used to govern AI are just as secure and private as the data the AI is processing.
A Blueprint for Navigating the Transition to Autonomous AgentOps
The journey toward a mature AgentOps strategy required organizations to carefully match their tooling to their specific stage of development. In the early phases, the primary focus was often on specialized debugging tools that allowed developers to iterate rapidly on prompt engineering and model selection. As these projects moved toward production, the emphasis shifted toward enterprise-scale observability platforms capable of managing high volumes of traffic and complex multi-agent interactions. Teams recognized that a tool useful for a single-developer prototype was rarely sufficient for a global deployment, and the successful transition relied on the early implementation of scalable monitoring architectures that could grow alongside the application’s user base.
Establishing real-time guardrails became a foundational requirement for any enterprise looking to mitigate the risks associated with data leakage and toxic model behavior. These safety layers functioned as a final filter, ensuring that every output adhered to corporate policies and ethical standards before it reached the end-user. Organizations determined that the most effective guardrails were those that were integrated directly into the inference pipeline, providing a sub-millisecond check on every generated token. This proactive security posture not only protected the brand’s reputation but also provided the necessary documentation for compliance audits, as every intervention by the guardrail system was meticulously logged and categorized for future review.
As the industry moved toward a future of autonomous operation, the role of the Site Reliability Engineer (SRE) underwent a radical transformation. The traditional manual oversight of servers and databases was increasingly replaced by a focus on cognitive oversight protocols and the management of “agent-driven” workflows. Practitioners established new best practices that prioritized the health of the agent’s logic and the efficiency of its resource consumption over simple hardware uptime. By the time these systems reached full maturity, the oversight process was largely automated, with AI agents themselves handling the vast majority of monitoring and remediation tasks. This shift allowed human engineers to focus on higher-level strategy and system design, marking the final step in the transition from human-led maintenance to a self-sustaining ecosystem of autonomous, high-performance cognitive systems.